Wednesday, December 4, 2013

0 Comments
Posted in Arrangement, Art, Business

How To Optimize Your Site With GZIP Compression

Compression is a simple, effective way to save bandwidth and speed up your site. I hesitated when recommending gzip compression when speeding up your javascriptbecause of problems in older browsers.

But it's the 21st century. Most of my traffic comes from modern browsers, and quite frankly, most of my users are fairly tech-savvy. I don't want to slow everyone else down because somebody is chugging along on IE 4.0 on Windows 95. Google and Yahoo use gzip compression. A modern browser is needed to enjoy modern web content and modern web speed -- so gzip encoding it is. Here's how to set it up.

Wait, wait, wait: Why are we doing this?

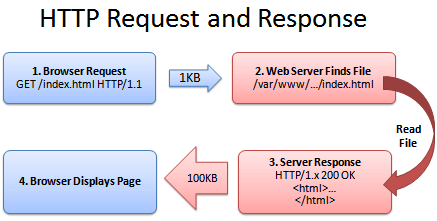
Before we start I should explain what content encoding is. When you request a file likehttp://www.yahoo.com/index.html, your browser talks to a web server. The conversation goes a little like this:
HTTP_request.png
1. Browser: Hey, GET me /index.html
2. Server: Ok, let me see if index.html is lying around...
3. Server: Found it! Here's your response code (200 OK) and I'm sending the file.
4. Browser: 100KB? Ouch... waiting, waiting... ok, it's loaded.
Of course, the actual headers and protocols are much more formal (monitor them withLive HTTP Headers if you're so inclined).
But it worked, and you got your file.

So what's the problem?

Well, the system works, but it's not that efficient. 100KB is a lot of text, and frankly,HTML is redundant. Every <html>, <table> and <div> tag has a closing tag that's almost the same. Words are repeated throughout the document. Any way you slice it,HTML (and its beefy cousin, XML) is not lean.
And what's the plan when a file's too big? Zip it!
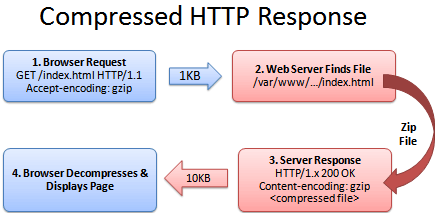
If we could send a .zip file to the browser (index.html.zip) instead of plain old index.html, we'd save on bandwidth and download time. The browser could download the zipped file, extract it, and then show it to user, who's in a good mood because the page loaded quickly. The browser-server conversation might look like this:
HTTP_request_compressed.png
1. Browser: Hey, can I GET index.html? I'll take a compressed version if you've got it.
2. Server: Let me find the file... yep, it's here. And you'll take a compressed version? Awesome.
3. Server: Ok, I've found index.html (200 OK), am zipping it and sending it over.
4. Browser: Great! It's only 10KB. I'll unzip it and show the user.
The formula is simple: Smaller file = faster download = happy user.
Don't believe me? The HTML portion of the yahoo home page goes from 101kb to 15kb after compression:
yahoo_compression.PNG

The (not so) hairy details

The tricky part of this exchange is the browser and server knowing it's ok to send a zipped file over. The agreement has two parts
  • The browser sends a header telling the server it accepts compressed content (gzip and deflate are two compression schemes): Accept-Encoding: gzip, deflate
  • The server sends a response if the content is actually compressed: Content-Encoding: gzip
If the server doesn't send the content-encoding response header, it means the file is not compressed (the default on many servers). The "Accept-encoding" header is just a request by the browser, not a demand. If the server doesn't want to send back compressed content, the browser has to make do with the heavy regular version.

Setting up the server

The "good news" is that we can't control the browser. It either sends the Accept-encoding: gzip, deflate header or it doesn't.
Our job is to configure the server so it returns zipped content if the browser can handle it, saving bandwidth for everyone (and giving us a happy user).
For IIS, enable compression in the settings.
In Apache, enabling output compression is fairly straightforward. Add the following to your .htaccess file:

# compress text, html, javascript, css, xml:
AddOutputFilterByType DEFLATE text/plain
AddOutputFilterByType DEFLATE text/html
AddOutputFilterByType DEFLATE text/xml
AddOutputFilterByType DEFLATE text/css
AddOutputFilterByType DEFLATE application/xml
AddOutputFilterByType DEFLATE application/xhtml+xml
AddOutputFilterByType DEFLATE application/rss+xml
AddOutputFilterByType DEFLATE application/javascript
AddOutputFilterByType DEFLATE application/x-javascript

# Or, compress certain file types by extension:
<files *.html>
SetOutputFilter DEFLATE
</files>

Apache actually has two compression options:
  • mod_deflate is easier to set up and is standard.
  • mod_gzip seems more powerful: you can pre-compress content.
Deflate is quick and works, so I use it; use mod_gzip if that floats your boat. In either case, Apache checks if the browser sent the "Accept-encoding" header and returns the compressed or regular version of the file. However, some older browsers may have trouble (more below) and there are special directives you can add to correct this.
If you can't change your .htaccess file, you can use PHP to return compressed content. Give your HTML file a .php extension and add this code to the top:
In PHP:
<?php if (substr_count($_SERVER['HTTP_ACCEPT_ENCODING'], 'gzip')) ob_start("ob_gzhandler"); else ob_start(); ?>
We check the "Accept-encoding" header and return a gzipped version of the file (otherwise the regular version). This is almost like building your own webserver (what fun!). But really, try to use Apache to compress your output if you can help it. You don't want to monkey with your files.

Verify Your Compression

Once you've configured your server, check to make sure you're actually serving up compressed content.
  • Online: Use the online gzip test to check whether your page is compressed.
  • In your browser: Use Web Developer Toolbar > Information > View Document Size (like I did for Yahoo, above) to see whether the page is compressed.
  • View the headers: Use Live HTTP Headers to examine the response. Look for a line that says "Content-encoding: gzip".
Be prepared to marvel at the results. The instacalc homepage shrunk from 36k to 10k, a 75% reduction in size.

Try Some Examples

I've set up some pages and a downloadable example:
  • index.html - No explicit compression (on this server, I am using compression by default :) ).
  • index.htm - Explicitly compressed with Apache .htaccess using *.htm as a rule
  • index.php - Explicitly compressed using the PHP header
Feel free to download the files, put them on your server and tweak the settings.

Caveats

As exciting as it may appear, HTTP Compression isn't all fun and games. Here's what to watch out for:
  • Older browsers: Yes, some browsers still may have trouble with compressed content (they say they can accept it, but really they can't). If your site absolutely must work with Netscape 1.0 on Windows 95, you may not want to use HTTPCompression. Apache mod_deflate has some rules to avoid compression for older browsers.
  • Already-compressed content: Most images, music and videos are already compressed. Don't waste time compressing them again. In fact, you probably only need to compress the "big 3" (HTML, CSS and Javascript).
  • CPU-load: Compressing content on-the-fly uses CPU time and saves bandwidth. Usually this is a great tradeoff given the speed of compression. There are ways to pre-compress static content and send over the compressed versions. This requires more configuration; even if it's not possible, compressing output may still be a net win. Using CPU cycles for a faster user experience is well worth it, given the short attention spans on the web.
Enabling compression is one of the fastest ways to improve your site's performance. Go forth, set it up, and let your users enjoy the benefits.

Friday, November 29, 2013

0 Comments
Posted in Arrangement, Art, Business

How to Enable mod_deflate GZIP Compression on CPanel Web Hosts

Web hosts managed by cPanel control panel can have GZIP compression enabled by using mod_deflate on Apache 2.x (Apache 2.0 or Apache 2.2 HTTPD server). GZIP compression can compress and reduce the size of web pages that been transmitted and sent to requester, saving bandwidth and speed up website speed. cPanel has built-in mechanism to turn on and enable mod_deflate module (or mod_gzip on Apache 1.3 which is not the scope here), with all configuration, settings and setup can be done using WebHost Manager without manually editing httpd.conf Apache config file.

cPanel supports enabling of mod_deflate on per account or per server (globally for all accounts and websites) basic. Regardless of which kind of implementation prefer, the prerequisite is to compile Apache with Deflate module support.
Prerequisite: Compiling Apache with mod_deflate Module
Note: The step can be skipped if mod_deflate has already been compiled into Apache. To verify, runhttpd -t -D DUMP_MODULES command on the server, and look for deflate_module (static), or by viewing details of Previously Saved Config in EasyApache, where mod_deflate is listed as Deflate.
Login to cPanel WHM (WebHost Manager), and run EasyApache (Apache Update) under Software section. Select radio button of Previously Saved Config, and click on Start customizing based on profile button.
Do whatever changes you prefer during each steps of wizard, else just click Next Step buttons, and finally click Exhaustive Options List button. Select and tick the check box for Deflate under Apache Built-in Modules. Click on Save and Build to start re-building Apache.
mod_deflate or deflate module will be built statically into Apache web server engine.
Method 1: Enable GZIP Compression on Per Account Basis
Login to cPanel account for the user account which GZIP compression wants to be turned on. Then click on Optimize Website under Software / Services.
User will be presented with options to compress all content or compress the specified MIME types, with a text box to specify file types to compress is selected (default is text/html text/plain text/xml). Choose either one setting to enable GZIP compression on all websites hosted by the particular account. Click on Update Settings when done.
Tip: Possible MIME types include text/html, text/plain, text/xml, text/css, text/javascript, application/javascript, application/xhtml+xml, application/xml, application/rss+xml, application/atom_xml, application/x-javascript, application/x-httpd-php, application/x-httpd-fastphp, application/x-httpd-eruby, and image/svg+xml.
Method 2: Turn Off mod_deflate GZIP Compress for Whole Server Globally
Login to WebHost Manager (WHM), and go to Services Configuration -> Apache Configuration ->Include Editor -> Post VirtualHost Include. Select All Versions for “I wish to edit the Post VirtualHost configuration include file for” option.
Copy and paste the following code into the opened text box, and hit Update button:
<IfModule mod_deflate.c>
SetOutputFilter DEFLATE
<IfModule mod_setenvif.c>
# Netscape 4.x has some problems…
BrowserMatch ^Mozilla/4 gzip-only-text/html
# Netscape 4.06-4.08 have some more problems
BrowserMatch ^Mozilla/4\.0[678] no-gzip
# MSIE masquerades as Netscape, but it is fine
BrowserMatch \bMSIE !no-gzip !gzip-only-text/html
# NOTE: Due to a bug in mod_setenvif up to Apache 2.0.48
# the above regex won’t work. You can use the following
# workaround to get the desired effect:
#BrowserMatch \bMSI[E] !no-gzip !gzip-only-text/html
# Don’t compress already-compressed files
SetEnvIfNoCase Request_URI .(?:gif|jpe?g|png)$ no-gzip dont-vary
SetEnvIfNoCase Request_URI .(?:exe|t?gz|zip|bz2|sit|rar)$ no-gzip dont-vary
SetEnvIfNoCase Request_URI .(?:avi|mov|mp3|mp4|rm|flv|swf|mp?g)$ no-gzip dont-vary
SetEnvIfNoCase Request_URI .pdf$ no-gzip dont-vary
</IfModule>
<IfModule mod_headers.c>
# Make sure proxies don’t deliver the wrong content
Header append Vary User-Agent env=!dont-vary
</IfModule>
</IfModule>
Note: Above code is just an example, and can be changed, especially on the exclusion part.
Restart the Apache service after saving the change to make the change effective.
Another alternative, especially for webmasters on shared web hosting which does not have Deflate compiled into Apache, is to enable GZIP compression on PHP.
Check and verify that the GZIP compression is running on the website. If you want to log the compression ratio to a file, here’s the directives to add to enable the mod_deflate GZIP compression ratio logging.

Tuesday, October 29, 2013

0 Comments
Posted in Arrangement, Art, Business

How to move emails from one server to another one

1. Install Thunderbird and Outlook on the same PC.
2. Configure POP3 accounts in Outlook and download all the emails from your current hosting provider to your local computer
3. Import mail from Outlook to Thunderbird. In Thunderbird, open the import wizard via Tools->Import menu.
4. Point the domain names to your new hosting account with us so it could resolve from our side
5. Please make sure to have the same email accounts created on the end of your new hosting provider
6. Create an IMAP account in Thunderbird.
7. Select all the imported emails, right click, select ‘move’, move them to your imap inbox. by default Thunderbird will sync email with new mail server, so it will begin to upload all the moved emails to the server.
8. That’s all. 

Sunday, October 20, 2013

0 Comments
Posted in Arrangement, Art, Business

Change prefix of the database

Step1. Backup your Database
Create a backup copy of your WordPress database from your phpMyAdmin Web interface using the Export function. How to do that?
Log into your phpMyAdmin and select your WordPress database.
Click on the "Export" tab at the top.
Follow the instructions as shown in the image below.

Step2. Change all your WordPress Table Names
In your phpMyAdmin and from your WordPress database, select the SQL tab and enter the following commands to rename all your 11 tables at once and click "GO". Depending on what plugins you installed, you might have more tables starting with “wp_” prefix, that need editing, make sure to rename all tables.
For instance, let´s say you want to replace wp_ with wpr12f_, then Run the following SQLcommands as shown in the code and image below.
1
2
3
4
5
6
7
8
9
10
11
Rename table wp_commentmeta TO wpr12f_commentmeta;
Rename table wp_comments TO wpr12f_comments;
Rename table wp_links TO wpr12f_links;
Rename table wp_options TO wpr12f_options;
Rename table wp_postmeta TO wpr12f_postmeta;
Rename table wp_posts TO wpr12f_posts;
Rename table wp_terms TO wpr12f_terms;
Rename table wp_term_relationships TO wpr12f_term_relationships;
Rename table wp_term_taxonomy TO wpr12f_term_taxonomy;
Rename table wp_usermeta TO wpr12f_usermeta;
Rename table wp_users TO wpr12f_users;

If you can´t see the new table names, either refresh the page or logout from phpMyAfmin and log back in.
In my case single quotes around table names cause syntax error. In your case you might need to add single quotes.
Step3. Edit the _options Table
Now search the wpr12f_options table for any instances of the old prefix (wp_). To do this, select the wpr12f_options table and click on the “Browse” tab. You will see all the records stored in that table. Search under the option_name field and changewp_user_roles along with any other records (starting with wp_) created by plugins, custom scripts, and probably others. Rename any options that begin with wp_ to the new prefix. You can change each record by clicking on the "Edit" pencil image for that record.Make sure not to miss any records.

You can also execute a SQL command to find the records that need editing:
1
SELECT * FROM wpr12f_options WHERE option_name LIKE 'wp_%';
See the image below:

Step4. Edit the _usermeta Table
Now do the same thing for the wpr12f_usermeta table, search for all instances of the oldwp_ prefix. Select the wpr12f_usermeta table and then click on the “Browse” tab. Search under the meta_key field all records that start with the old wp_ prefix. Edit each record it by clicking on the "Edit" pencil image for that record. Make sure not to miss any records.

Do NOT edit any records starting with the prefix _wp_, but only records staring with the prefix wp_
You can also execute a SQL command here to find the records that needs editing:
1
SELECT * FROM wpr12f_usermeta WHERE meta_key LIKE 'wp_%';
See the image below:

Step5. Edit Your wp-config.php File
Now open your wp-config.php file and change your table prefix in from wp_ to whatever prefix you decide to use (wpr12f_ for this tutorial). Save and upload it to your server, as shown in the following code snippet:
1
2
3
4
5
6
7
8
/**
 * WordPress Database Table prefix.
 * You can have multiple installations in one database if you give each a unique
 * prefix. Only numbers, letters, and underscores please!
 */
//Rename the table prefix variable from the default 'wp_' to a new hard to
//guess and more secure prefix.
$table_prefix  = 'wpr12f_';
Step6. Test your WordPress Website
Now vigorously test your Website for proper functionality. Test your plugins, contact form, search field, posts, pages, comments, administration area, and anything else you can think of. If your Website is working as before, then the tables prefix change is a success.
Step7. Do Another Backup
Go ahead and do another backup of your database as a good and wise habit.


Sunday, October 13, 2013

0 Comments
Posted in Arrangement, Art, Business

How to configure Windows Live email client with Open-Xchange

  1. Launch Windows Live Mail from the Start Menu.
  2. Go to the Tools menu, and then select All Accounts.
  3. In the navigation column, click Add e-mail account.
  4. In the Email Address field, enter your full email address.
  5. In the Password field, enter your password.
  6. Select if you want to Remember Password.
  7. In the Display Name field, enter how you want your name to display when email is sent from this account, and then click Next.
  8. Select your server type and enter your Incoming POP or IMAP Server. 
  9. Incoming server Port:

    IMAP without SSL - 143
    IMAP with SSL - 993
    POP without SSL - 110
    POP with SSL - 995
  10. Select This server requires a secure connection (SSL) if you are using a port with SSL.
  11. Select to log on using Clear text authentication.
  12. In the Login ID field, enter your full email address.
  13. In the Outgoing server field, enter oxmail.registrar-servers.com
  14. Outgoing server Port:

    Without SSL - one of the following: 25
    With SSL - 465
  15. Select This server requires a secure connection (SSL) if you are using a port with SSL.
  16. Select My outgoing server requires authentication, and then click Next.
  17. Click Finish.
0 Comments
Posted in Arrangement, Art, Business

How To Use FTP Through the Command Line in Mac OS X

1. Connecting to an FTP Server

To establish a connection with an FTP server, you’ll need to know your username and password, in addition to the server you’re connecting to. To open a connection in Terminal (located in /Applications/Utilities), type the following command, replacing the underlined portions with your server:

ftp YourServerHere.com

After a few seconds, you’ll be prompted for your username and password by the server. Type those in, pressing enter after entering each piece of information.

2. Browsing Around

After you’ve gotten the “ftp>” line displayed, you can issue the FTP server a command. To list the files in a particular folder, type ls (that’s LS in lower-case), then press enter.

Files will have a dash (-) as the first character in the leftmost column and folders will have a d listed (the d stands for directory).

To navigate into a folder, type cd (as in “change directory”), followed by the directory name you want to change to. Then, press enter to send the command to the server.

So, if I wanted to list the files in my Documents Folder, I would first type in:

ftp> cd Documents

ftp> ls 


The files and folders in the Documents folder would then be listed. I could further navigate to another folder or download/upload a file to the current directory.

3. Uploading or Downloading from the Server

Download a file is easy. First, navigate to the folder containing the file you want to download. Next, type in the following command, specifying the file you want to download in place of the underlined text:

get file_name_here.pdf

Any files you download will appear in the Home directory of the currently logged in user on your Mac.

Uploading a file to the server is just as easy. Instead of “get”, you’re going to use “put” then the filename of the file on your local machine. So, if I had a file on my Desktop called Downloads.rtf that I wanted to put on the server in my Documents folder, I would type the following command:

put ~/Desktop/Download.rtf ~/Documents/Download.rtf

The first statement after the put command is the location on your local machine containing the file, in this case, ~/Desktop/Download.rtf; the second statement is the location on the server where the file should reside after upload, in this case ~/Documents/Download.rtf.

4. List of Commands

As you can see, the command line FTP client can be great when you’re in a pinch and need to do some basic FTP server work. Just to recap, here’s a list of the basic commands that you can use with the FTP client built into Mac OS X.

put filename - Upload a file to the server
get filename - Download a file from the server
mput filename - Put multiple files on the server
mget filename - Get multiple files on the server
ls - Get a list of files in the current directory
cd - Change directory
quit - Ends your ftp session

Wednesday, September 11, 2013

0 Comments
Posted in Arrangement, Art, Business

20 Linux System Monitoring Tools Every SysAdmin Should Know

Need to monitor Linux server performance? Try these built-in commands and a few add-on tools. Most Linux distributions are equipped with tons of monitoring. These tools provide metrics which can be used to get information about system activities. You can use these tools to find the possible causes of a performance problem. The commands discussed below are some of the most basic commands when it comes to system analysis and debugging server issues such as:
  1. Finding out bottlenecks.
  2. Disk (storage) bottlenecks.
  3. CPU and memory bottlenecks.
  4. Network bottlenecks.

#1: top - Process Activity Command

The top program provides a dynamic real-time view of a running system i.e. actual process activity. By default, it displays the most CPU-intensive tasks running on the server and updates the list every five seconds.
Fig.01: Linux top command

Commonly Used Hot Keys

The top command provides several useful hot keys:
Hot KeyUsage
tDisplays summary information off and on.
mDisplays memory information off and on.
ASorts the display by top consumers of various system resources. Useful for quick identification of performance-hungry tasks on a system.
fEnters an interactive configuration screen for top. Helpful for setting up top for a specific task.
oEnables you to interactively select the ordering within top.
rIssues renice command.
kIssues kill command.
zTurn on or off color/mono

#2: vmstat - System Activity, Hardware and System Information

The command vmstat reports information about processes, memory, paging, block IO, traps, and cpu activity.
# vmstat 3
Sample Outputs:
procs -----------memory---------- ---swap-- -----io---- --system-- -----cpu------
 r  b   swpd   free   buff  cache   si   so    bi    bo   in   cs us sy id wa st
 0  0      0 2540988 522188 5130400    0    0     2    32    4    2  4  1 96  0  0
 1  0      0 2540988 522188 5130400    0    0     0   720 1199  665  1  0 99  0  0
 0  0      0 2540956 522188 5130400    0    0     0     0 1151 1569  4  1 95  0  0
 0  0      0 2540956 522188 5130500    0    0     0     6 1117  439  1  0 99  0  0
 0  0      0 2540940 522188 5130512    0    0     0   536 1189  932  1  0 98  0  0
 0  0      0 2538444 522188 5130588    0    0     0     0 1187 1417  4  1 96  0  0
 0  0      0 2490060 522188 5130640    0    0     0    18 1253 1123  5  1 94  0  0

Display Memory Utilization Slabinfo

# vmstat -m

Get Information About Active / Inactive Memory Pages

#3: w - Find Out Who Is Logged on And What They Are Doing

w command displays information about the users currently on the machine, and their processes.
# w username
# w vivek

Sample Outputs:
 17:58:47 up 5 days, 20:28,  2 users,  load average: 0.36, 0.26, 0.24
USER     TTY      FROM              LOGIN@   IDLE   JCPU   PCPU WHAT
root     pts/0    10.1.3.145       14:55    5.00s  0.04s  0.02s vim /etc/resolv.conf
root     pts/1    10.1.3.145       17:43    0.00s  0.03s  0.00s w

#4: uptime - Tell How Long The System Has Been Running

The uptime command can be used to see how long the server has been running. The current time, how long the system has been running, how many users are currently logged on, and the system load averages for the past 1, 5, and 15 minutes.
# uptime
Output:
 18:02:41 up 41 days, 23:42,  1 user,  load average: 0.00, 0.00, 0.00
1 can be considered as optimal load value. The load can change from system to system. For a single CPU system 1 - 3 and SMP systems 6-10 load value might be acceptable.

#5: ps - Displays The Processes

ps command will report a snapshot of the current processes. To select all processes use the -A or -e option:
# ps -A
Sample Outputs:
  PID TTY          TIME CMD
    1 ?        00:00:02 init
    2 ?        00:00:02 migration/0
    3 ?        00:00:01 ksoftirqd/0
    4 ?        00:00:00 watchdog/0
    5 ?        00:00:00 migration/1
    6 ?        00:00:15 ksoftirqd/1
....
.....
 4881 ?        00:53:28 java
 4885 tty1     00:00:00 mingetty
 4886 tty2     00:00:00 mingetty
 4887 tty3     00:00:00 mingetty
 4888 tty4     00:00:00 mingetty
 4891 tty5     00:00:00 mingetty
 4892 tty6     00:00:00 mingetty
 4893 ttyS1    00:00:00 agetty
12853 ?        00:00:00 cifsoplockd
12854 ?        00:00:00 cifsdnotifyd
14231 ?        00:10:34 lighttpd
14232 ?        00:00:00 php-cgi
54981 pts/0    00:00:00 vim
55465 ?        00:00:00 php-cgi
55546 ?        00:00:00 bind9-snmp-stat
55704 pts/1    00:00:00 ps
ps is just like top but provides more information.

Show Long Format Output

# ps -Al
To turn on extra full mode (it will show command line arguments passed to process):
# ps -AlF

To See Threads ( LWP and NLWP)

# ps -AlFH

To See Threads After Processes

# ps -AlLm

Print All Process On The Server

# ps ax
# ps axu

Print A Process Tree

# ps -ejH
# ps axjf
# pstree

Print Security Information

# ps -eo euser,ruser,suser,fuser,f,comm,label
# ps axZ
# ps -eM

See Every Process Running As User Vivek

# ps -U vivek -u vivek u

Set Output In a User-Defined Format

# ps -eo pid,tid,class,rtprio,ni,pri,psr,pcpu,stat,wchan:14,comm
# ps axo stat,euid,ruid,tty,tpgid,sess,pgrp,ppid,pid,pcpu,comm
# ps -eopid,tt,user,fname,tmout,f,wchan

Display Only The Process IDs of Lighttpd

# ps -C lighttpd -o pid=
OR
# pgrep lighttpd
OR
# pgrep -u vivek php-cgi

Display The Name of PID 55977

# ps -p 55977 -o comm=

Find Out The Top 10 Memory Consuming Process

# ps -auxf | sort -nr -k 4 | head -10

Find Out top 10 CPU Consuming Process

# ps -auxf | sort -nr -k 3 | head -10

#6: free - Memory Usage

The command free displays the total amount of free and used physical and swap memory in the system, as well as the buffers used by the kernel.
# free
Sample Output:
            total       used       free     shared    buffers     cached
Mem:      12302896    9739664    2563232          0     523124    5154740
-/+ buffers/cache:    4061800    8241096
Swap:      1052248          0    1052248
=> Related: :
  1. Linux Find Out Virtual Memory PAGESIZE
  2. Linux Limit CPU Usage Per Process
  3. How much RAM does my Ubuntu / Fedora Linux desktop PC have?

#7: iostat - Average CPU Load, Disk Activity

The command iostat report Central Processing Unit (CPU) statistics and input/output statistics for devices, partitions and network filesystems (NFS).
# iostat
Sample Outputs:
Linux 2.6.18-128.1.14.el5 (www03.nixcraft.in)  06/26/2009
avg-cpu:  %user   %nice %system %iowait  %steal   %idle
           3.50    0.09    0.51    0.03    0.00   95.86
Device:            tps   Blk_read/s   Blk_wrtn/s   Blk_read   Blk_wrtn
sda              22.04        31.88       512.03   16193351  260102868
sda1              0.00         0.00         0.00       2166        180
sda2             22.04        31.87       512.03   16189010  260102688
sda3              0.00         0.00         0.00       1615          0

#8: sar - Collect and Report System Activity

The sar command is used to collect, report, and save system activity information. To see network counter, enter:
# sar -n DEV | more
To display the network counters from the 24th:
# sar -n DEV -f /var/log/sa/sa24 | more
You can also display real time usage using sar:
# sar 4 5
Sample Outputs:
Linux 2.6.18-128.1.14.el5 (www03.nixcraft.in)   06/26/2009
06:45:12 PM       CPU     %user     %nice   %system   %iowait    %steal     %idle
06:45:16 PM       all      2.00      0.00      0.22      0.00      0.00     97.78
06:45:20 PM       all      2.07      0.00      0.38      0.03      0.00     97.52
06:45:24 PM       all      0.94      0.00      0.28      0.00      0.00     98.78
06:45:28 PM       all      1.56      0.00      0.22      0.00      0.00     98.22
06:45:32 PM       all      3.53      0.00      0.25      0.03      0.00     96.19
Average:          all      2.02      0.00      0.27      0.01      0.00     97.70

#9: mpstat - Multiprocessor Usage

The mpstat command displays activities for each available processor, processor 0 being the first one. mpstat -P ALL to display average CPU utilization per processor:
# mpstat -P ALL
Sample Output:
Linux 2.6.18-128.1.14.el5 (www03.nixcraft.in)   06/26/2009
06:48:11 PM  CPU   %user   %nice    %sys %iowait    %irq   %soft  %steal   %idle    intr/s
06:48:11 PM  all    3.50    0.09    0.34    0.03    0.01    0.17    0.00   95.86   1218.04
06:48:11 PM    0    3.44    0.08    0.31    0.02    0.00    0.12    0.00   96.04   1000.31
06:48:11 PM    1    3.10    0.08    0.32    0.09    0.02    0.11    0.00   96.28     34.93
06:48:11 PM    2    4.16    0.11    0.36    0.02    0.00    0.11    0.00   95.25      0.00
06:48:11 PM    3    3.77    0.11    0.38    0.03    0.01    0.24    0.00   95.46     44.80
06:48:11 PM    4    2.96    0.07    0.29    0.04    0.02    0.10    0.00   96.52     25.91
06:48:11 PM    5    3.26    0.08    0.28    0.03    0.01    0.10    0.00   96.23     14.98
06:48:11 PM    6    4.00    0.10    0.34    0.01    0.00    0.13    0.00   95.42      3.75
06:48:11 PM    7    3.30    0.11    0.39    0.03    0.01    0.46    0.00   95.69     76.89

#10: pmap - Process Memory Usage

The command pmap report memory map of a process. Use this command to find out causes of memory bottlenecks.
# pmap -d PID
To display process memory information for pid # 47394, enter:
# pmap -d 47394
Sample Outputs:
47394:   /usr/bin/php-cgi
Address           Kbytes Mode  Offset           Device    Mapping
0000000000400000    2584 r-x-- 0000000000000000 008:00002 php-cgi
0000000000886000     140 rw--- 0000000000286000 008:00002 php-cgi
00000000008a9000      52 rw--- 00000000008a9000 000:00000   [ anon ]
0000000000aa8000      76 rw--- 00000000002a8000 008:00002 php-cgi
000000000f678000    1980 rw--- 000000000f678000 000:00000   [ anon ]
000000314a600000     112 r-x-- 0000000000000000 008:00002 ld-2.5.so
000000314a81b000       4 r---- 000000000001b000 008:00002 ld-2.5.so
000000314a81c000       4 rw--- 000000000001c000 008:00002 ld-2.5.so
000000314aa00000    1328 r-x-- 0000000000000000 008:00002 libc-2.5.so
000000314ab4c000    2048 ----- 000000000014c000 008:00002 libc-2.5.so
.....
......
..
00002af8d48fd000       4 rw--- 0000000000006000 008:00002 xsl.so
00002af8d490c000      40 r-x-- 0000000000000000 008:00002 libnss_files-2.5.so
00002af8d4916000    2044 ----- 000000000000a000 008:00002 libnss_files-2.5.so
00002af8d4b15000       4 r---- 0000000000009000 008:00002 libnss_files-2.5.so
00002af8d4b16000       4 rw--- 000000000000a000 008:00002 libnss_files-2.5.so
00002af8d4b17000  768000 rw-s- 0000000000000000 000:00009 zero (deleted)
00007fffc95fe000      84 rw--- 00007ffffffea000 000:00000   [ stack ]
ffffffffff600000    8192 ----- 0000000000000000 000:00000   [ anon ]
mapped: 933712K    writeable/private: 4304K    shared: 768000K
The last line is very important:
  • mapped: 933712K total amount of memory mapped to files
  • writeable/private: 4304K the amount of private address space
  • shared: 768000K the amount of address space this process is sharing with others

#11 and #12: netstat and ss - Network Statistics

The command netstat displays network connections, routing tables, interface statistics, masquerade connections, and multicast memberships. ss command is used to dump socket statistics. It allows showing information similar to netstat. See the following resources about ss and netstat commands:

#13: iptraf - Real-time Network Statistics

The iptraf command is interactive colorful IP LAN monitor. It is an ncurses-based IP LAN monitor that generates various network statistics including TCP info, UDP counts, ICMP and OSPF information, Ethernet load info, node stats, IP checksum errors, and others. It can provide the following info in easy to read format:
  • Network traffic statistics by TCP connection
  • IP traffic statistics by network interface
  • Network traffic statistics by protocol
  • Network traffic statistics by TCP/UDP port and by packet size
  • Network traffic statistics by Layer2 address
Fig.02: General interface statistics: IP traffic statistics by network interface
Fig.03 Network traffic statistics by TCP connection

#14: tcpdump - Detailed Network Traffic Analysis

The tcpdump is simple command that dump traffic on a network. However, you need good understanding of TCP/IP protocol to utilize this tool. For.e.g to display traffic info about DNS, enter:
# tcpdump -i eth1 'udp port 53'
To display all IPv4 HTTP packets to and from port 80, i.e. print only packets that contain data, not, for example, SYN and FIN packets and ACK-only packets, enter:
# tcpdump 'tcp port 80 and (((ip[2:2] - ((ip[0]&0xf)<<2)) - ((tcp[12]&0xf0)>>2)) != 0)'
To display all FTP session to 202.54.1.5, enter:
# tcpdump -i eth1 'dst 202.54.1.5 and (port 21 or 20'
To display all HTTP session to 192.168.1.5:
# tcpdump -ni eth0 'dst 192.168.1.5 and tcp and port http'
Use wireshark to view detailed information about files, enter:
# tcpdump -n -i eth1 -s 0 -w output.txt src or dst port 80

#15: strace - System Calls

Trace system calls and signals. This is useful for debugging webserver and other server problems. See how to use to trace the process and see What it is doing.

#16: /Proc file system - Various Kernel Statistics

/proc file system provides detailed information about various hardware devices and other Linux kernel information. See Linux kernel /proc documentations for further details. Common /proc examples:
# cat /proc/cpuinfo
# cat /proc/meminfo
# cat /proc/zoneinfo
# cat /proc/mounts

17#: Nagios - Server And Network Monitoring

Nagios is a popular open source computer system and network monitoring application software. You can easily monitor all your hosts, network equipment and services. It can send alert when things go wrong and again when they get better. FAN is "Fully Automated Nagios". FAN goals are to provide a Nagios installation including most tools provided by the Nagios Community. FAN provides a CDRom image in the standard ISO format, making it easy to easilly install a Nagios server. Added to this, a wide bunch of tools are including to the distribution, in order to improve the user experience around Nagios.

18#: Cacti - Web-based Monitoring Tool

Cacti is a complete network graphing solution designed to harness the power of RRDTool's data storage and graphing functionality. Cacti provides a fast poller, advanced graph templating, multiple data acquisition methods, and user management features out of the box. All of this is wrapped in an intuitive, easy to use interface that makes sense for LAN-sized installations up to complex networks with hundreds of devices. It can provide data about network, CPU, memory, logged in users, Apache, DNS servers and much more. See how to install and configure Cacti network graphing tool under CentOS / RHEL.

#19: KDE System Guard - Real-time Systems Reporting and Graphing

KSysguard is a network enabled task and system monitor application for KDE desktop. This tool can be run over ssh session. It provides lots of features such as a client/server architecture that enables monitoring of local and remote hosts. The graphical front end uses so-called sensors to retrieve the information it displays. A sensor can return simple values or more complex information like tables. For each type of information, one or more displays are provided. Displays are organized in worksheets that can be saved and loaded independently from each other. So, KSysguard is not only a simple task manager but also a very powerful tool to control large server farms.
Fig.05 KDE System Guard
Fig.05 KDE System Guard {Image credit: Wikipedia}
See the KSysguard handbook for detailed usage.

#20: Gnome System Monitor - Real-time Systems Reporting and Graphing

The System Monitor application enables you to display basic system information and monitor system processes, usage of system resources, and file systems. You can also use System Monitor to modify the behavior of your system. Although not as powerful as the KDE System Guard, it provides the basic information which may be useful for new users:
  • Displays various basic information about the computer's hardware and software.
  • Linux Kernel version
  • GNOME version
  • Hardware
  • Installed memory
  • Processors and speeds
  • System Status
  • Currently available disk space
  • Processes
  • Memory and swap space
  • Network usage
  • File Systems
  • Lists all mounted filesystems along with basic information about each.
Fig.06 The Gnome System Monitor application

Bonus: Additional Tools

A few more tools:
  • nmap - scan your server for open ports.
  • lsof - list open files, network connections and much more.
  • ntop web based tool - ntop is the best tool to see network usage in a way similar to what top command does for processes i.e. it is network traffic monitoring software. You can see network status, protocol wise distribution of traffic for UDP, TCP, DNS, HTTP and other protocols.
  • Conky - Another good monitoring tool for the X Window System. It is highly configurable and is able to monitor many system variables including the status of the CPU, memory, swap space, disk storage, temperatures, processes, network interfaces, battery power, system messages, e-mail inboxes etc.
  • GKrellM - It can be used to monitor the status of CPUs, main memory, hard disks, network interfaces, local and remote mailboxes, and many other things.
  • vnstat - vnStat is a console-based network traffic monitor. It keeps a log of hourly, daily and monthly network traffic for the selected interface(s).
  • htop - htop is an enhanced version of top, the interactive process viewer, which can display the list of processes in a tree form.
  • mtr - mtr combines the functionality of the traceroute and ping programs in a single network diagnostic tool.

    Blogger news

    Blogroll

    About